The debate over AI and jobs finally has hard data, and it points in one direction: entry-level knowledge work is shrinking while AI-skilled hiring grows. A new report from the Partnership for New York City, released in early October 2026, finds that entry-level job postings in design, media and writing have fallen 40.6% since 2022. This pillar post puts that finding alongside every other major study we could verify, so you can see what the data actually says, and what it does not.
The anchor: New York's 40% number
The Partnership for New York City analyzed Lightcast job advertisements, federal employment data and Stanford's AI exposure index, which measures how much of an occupation's skills AI could augment. The findings, published October 2, 2026:
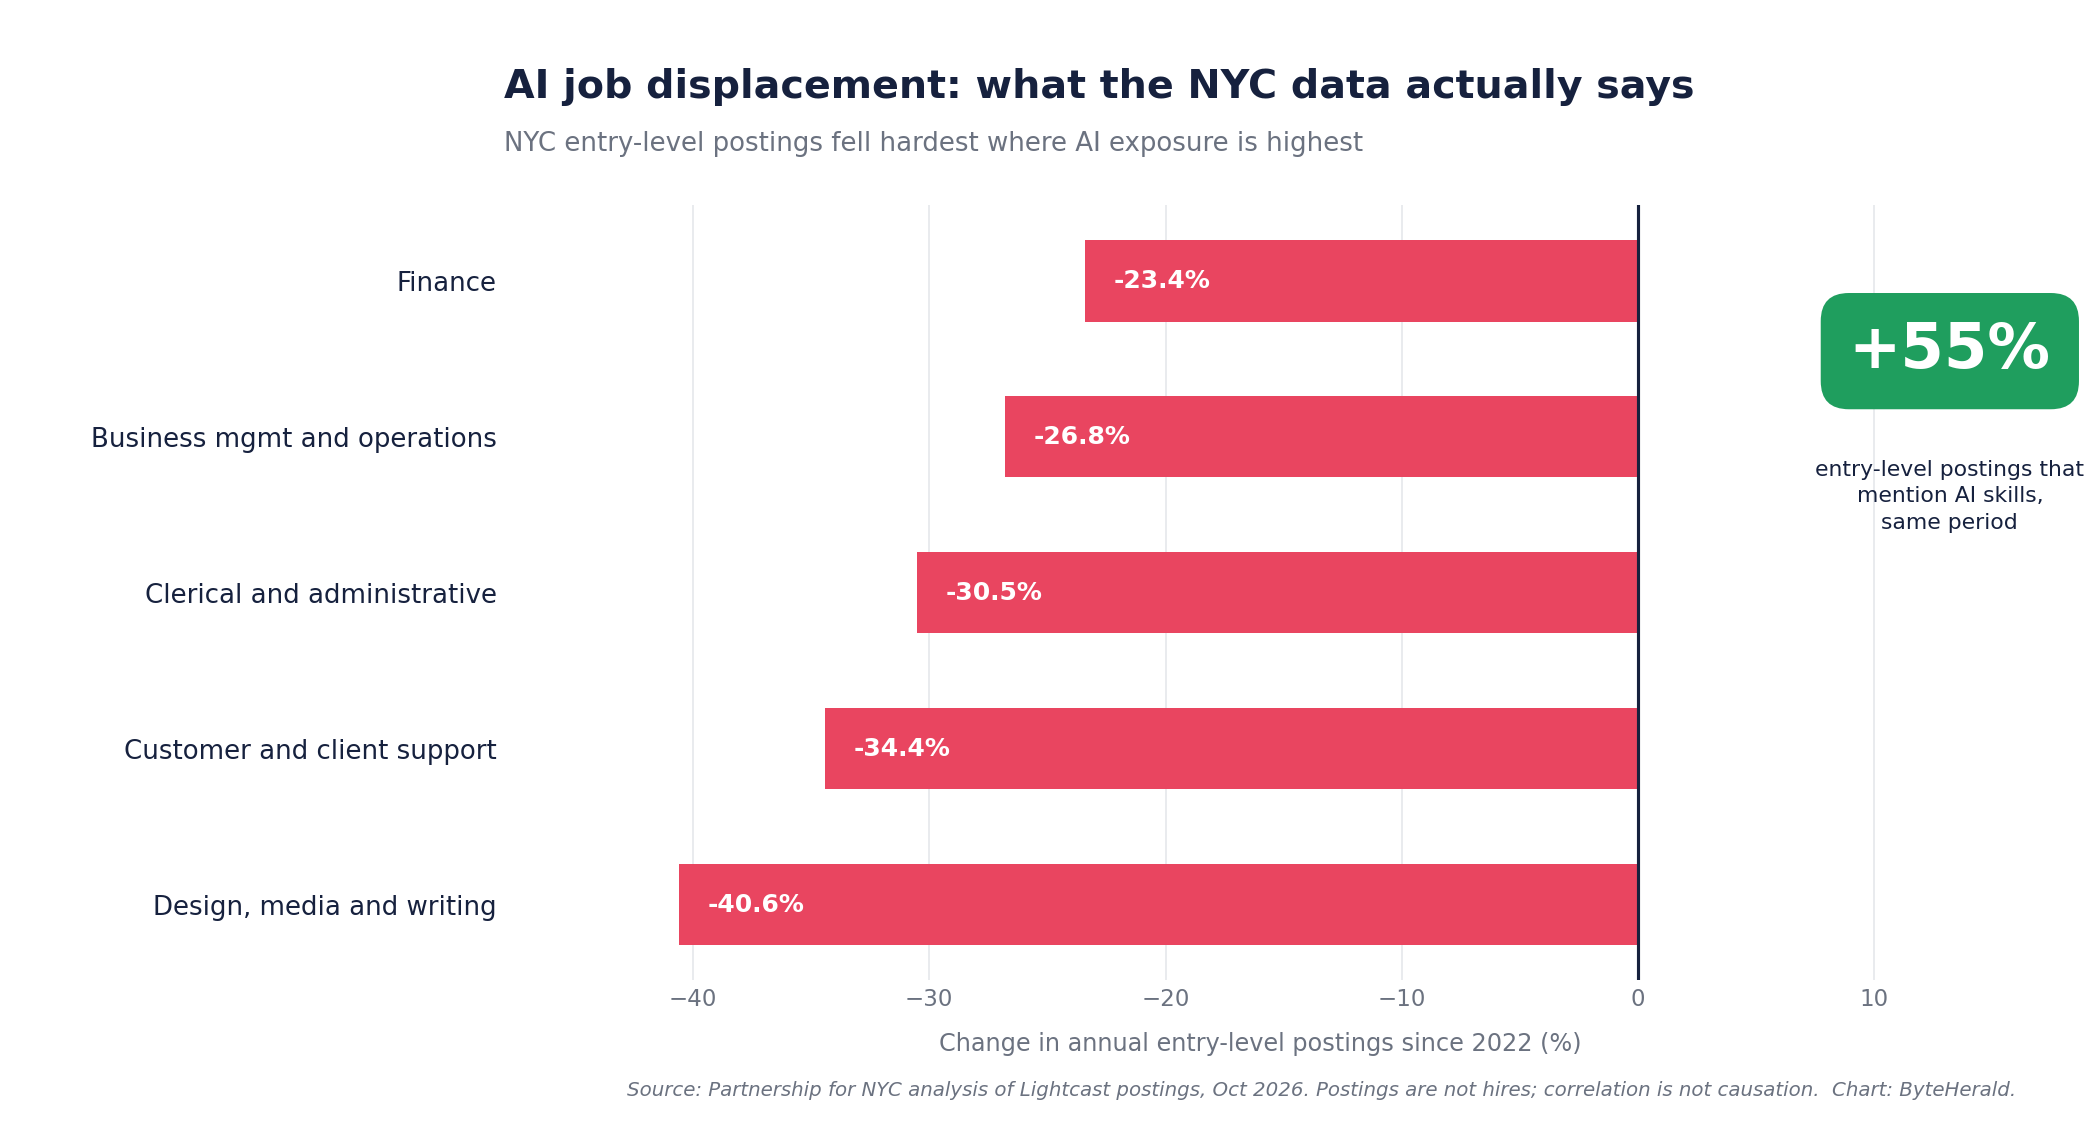
- Annual entry-level postings since 2022 fell 40.6% in design, media and writing; 34.4% in customer and client support; 30.5% in clerical and administrative work; 26.8% in business management and operations; and 23.4% in finance. Each of these groups has more than 50% AI exposure.
- Over the same period, entry-level postings mentioning AI skills rose 55%. Employers sought people who could apply, deploy and supervise AI systems.
- Yet AI companies leased more than 2.2 million square feet of NYC office space in the first half of 2026, more than double their 2025 total, and AI startups raised a record $16.7 billion in venture capital in 2025. Employment through August 2026 grew just 0.6% in financial services, 0.04% in professional and business services, and declined nearly 2% in the information sector.
The Partnership is a business advocacy group, and its own analysis carries the honest caveat: job postings are not hires, layoffs, or proof of displacement, and the analysis does not establish that AI caused the declines. What it establishes is that the bottom rung of the white-collar ladder is contracting in the occupations most exposed to AI.
The comparison table: every major study, one view
| Study | Data | Headline finding | Caveat |
|---|---|---|---|
| Partnership for NYC (Oct 2026) | Lightcast postings, 2022-2026 | Entry-level postings down 40.6% in design/media/writing; AI-skill postings up 55% | Postings, not hires; correlation with AI exposure, not causation |
| Center for an Urban Future (Sep 2026) | NYC postings, 2022-2025 | Entry-level tech postings down 49%; postings seeking AI skills up more than 8,000% | Concentrated at entry level, not broad layoffs; business cycle plays a role |
| Stanford Digital Economy Lab (2026) | ADP payroll data, 3.5-5M workers monthly through June 2026 | 19% employment gap for ages 22-25 in AI-exposed occupations vs less-exposed peers; mainly from reduced hiring | Authors call it an early indicator, not a causal estimate; experienced workers show no gap |
| Anthropic Economic Index (2026) | Real Claude usage, mapped to occupations | Nearly 40% of Claude conversations are analytical/writing tasks; programmers have 75% of tasks covered by observed AI use | Measures usage, not displacement; no systematic unemployment rise in exposed occupations since late 2022 |
| Anthropic "Economic Scenarios for Transformative AI" (Sep 2026) | Task-based economic model to 2030 | Extreme scenario: 17.9% unemployment in cognitive professions; labor share of income falls from 60% to 45% | Scenario model, not a forecast; excludes policy responses; Anthropic sells the technology |
| ILO (2025) | Global occupation data | One in four jobs worldwide (24%) has some generative-AI exposure; one in three in high-income countries | Exposure is not automation; clerical ranks highest, not all jobs |
| WEF Future of Jobs (2025) | Employer surveys, global | Net +78 million jobs by 2030: 170 million created, 92 million displaced | Projections, not measurements; timing and geography uneven |
What the pattern actually says
Three conclusions survive contact with the caveats. First, the damage concentrates at the entry level, not across the workforce: payroll data shows experienced workers in AI-exposed jobs are fine while 22 to 25-year-olds fall 19% behind, and the declines come from hiring freezes rather than layoffs. The career ladder is losing its bottom rung.
Second, exposure is occupation-specific, and the most exposed work is the work AI demonstrably does. Computer programmers have the highest observed AI task coverage of any occupation, three quarters of their tasks. That is why our benchmark of five AI coding assistants matters beyond developer tooling: it is a direct measure of how much of a programmer's week an agent can now absorb. Similarly, the automation of knowledge production, from OpenAI's AI writing 722 math manuscripts to the NYC writing-posting collapse, shows the same pressure on research and writing work.
Third, the doomsday and the denial are both wrong. US unemployment remains low; Anthropic's own index finds no systematic unemployment increase in the most exposed occupations. But Sam Altman himself said in May that he had been "pretty wrong" about the expected fallout and was "delighted" the jobs apocalypse had not arrived, a statement that reads differently now that the 2026 payroll and postings data show young workers absorbing the shock first. The aggregate economy is fine. The entry-level pipeline is not.
ByteHerald's reading
The honest summary of the data: AI is not causing mass unemployment, but it is reshaping who gets hired and for what. Employers want fewer junior workers and more workers who can supervise AI, as the 55% rise in AI-skill postings shows. For a new graduate in design, media or writing, the market of 2026 is measurably harder than 2022. For policymakers, the Partnership's recommendation is the right one: track entry-level hiring, not just AI investment, because the investment numbers and the hiring numbers are telling opposite stories. We will update this comparison as new payroll and postings data arrives.
By ByteHerald Staff. All figures sourced from the reports named above via their published coverage; each study's caveats are stated in the table. This is a synthesis of verified studies, not original measurement.
Comments
Post a Comment