A Brown University senior's power map links 13 data-labeling companies to 141 of their corporate customers across 31 countries that contain data worker sites, showing the human labor chain that AI companies keep opaque. The map is not a census and its author says so, but it is the first public picture of its kind to connect the firms, the customers, and the countries in one drawing, and it reframes what an AI model is: not a mind that learned alone, but an aggregation of human knowledge, understanding, and effort.
The map in numbers
| What the map counts | Number | ByteHerald arithmetic |
|---|---|---|
| Data-labeling companies | 13 | One node per firm |
| Corporate customers | 141 | About 10.8 customers per firm |
| Countries with data worker sites | 31 | About 4.5 customers per country, about 2.4 countries per firm |
The ratios are ours, computed from Brown's three published counts, and they describe the map's shape, not the workforce's size. A firm with eleven customers on the map may employ thousands of workers or dozens; the map counts relationships, not headcount. That limitation is disclosed here because it is the easiest way to misread a power map: a dense drawing is not a large workforce, and a sparse drawing is not a small one. What the drawing proves is structure, that a small set of specialist firms sits between a large set of corporate customers and a dispersed workforce across thirty-one countries.
How a power map is built
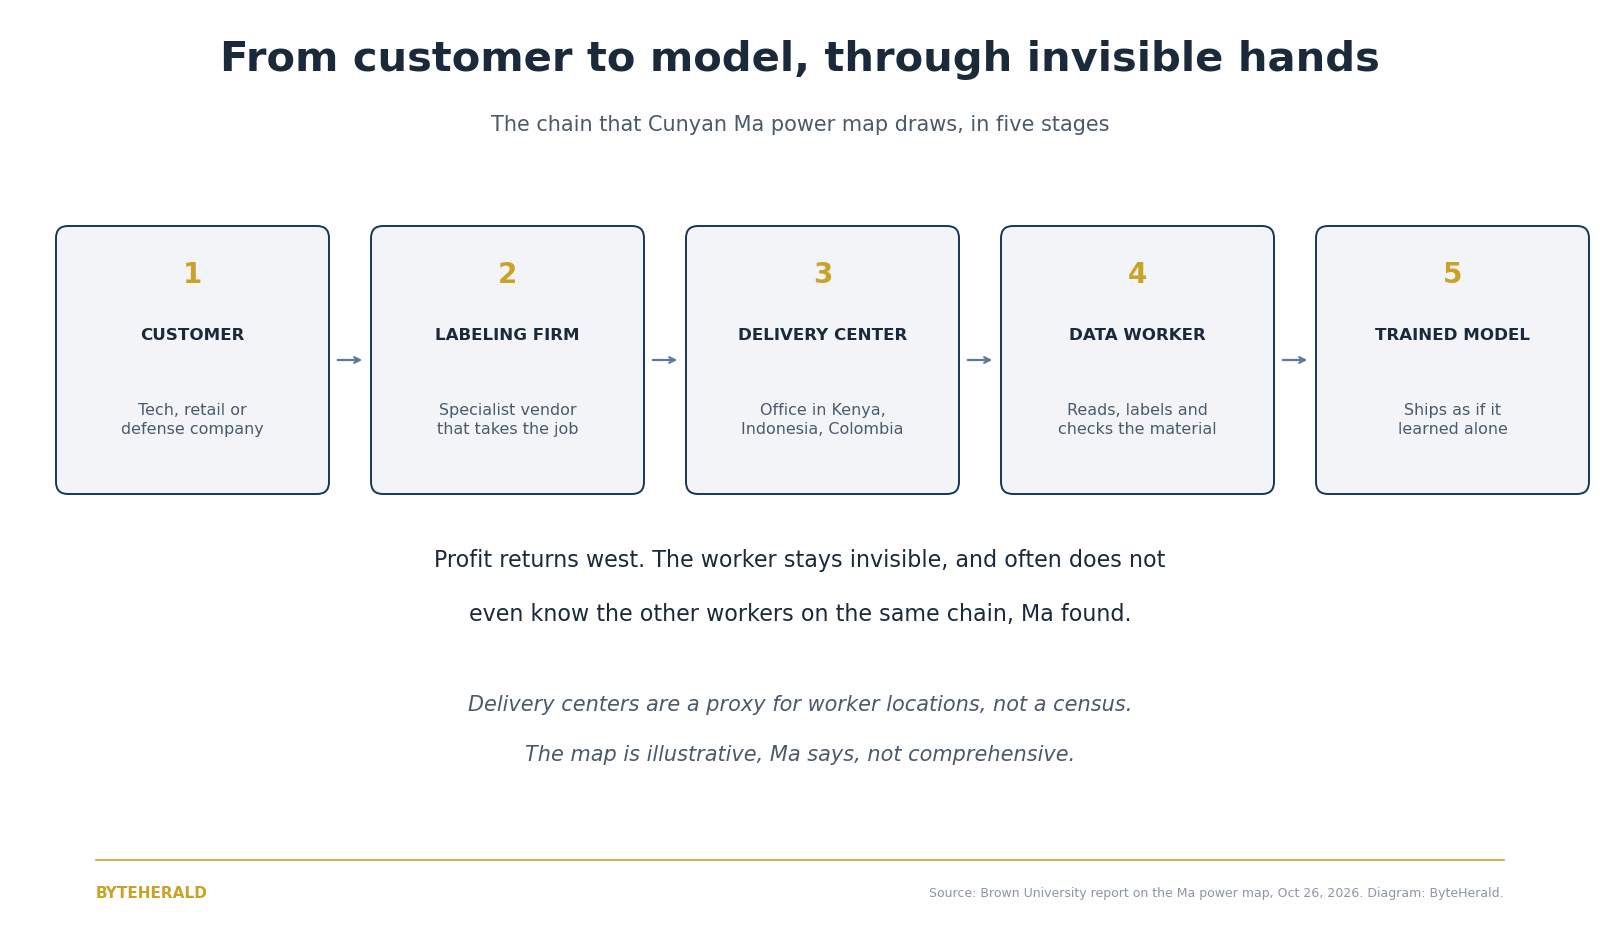
Cunyan Ma, a Brown senior concentrating in social analysis and research, built the map from two sources. The first was existing databases of data-labeling firms and their corporate customers, including the Data Work Landscape project. The second was her own original database of data-labeling firms' delivery centers, used as a proxy for where data workers are located. The map draws lines between those nodes: firm to customer, firm to delivery center, delivery center to country. Her advisor, computer science professor Suresh Venkatasubramanian, who leads Brown's Center for Technological Responsibility, Reimagination and Redesign, put the stakes in one sentence: it is all humans underneath, and the discourse that treats AI as its own sentient being hides the people who built it.
What the work actually is
Most corporations, from social media and tech firms to retailers and defense companies, outsource data labeling to specialist firms, Brown reports, and those firms look for inexpensive labor. Ma's description of how that manifests is blunt: companies outsource the work to the Global South, to Kenya, Indonesia, Colombia, and elsewhere, where workers read paragraph after paragraph of disturbing material, including violent and sexual content, to train AI to be safe. That is the essence of what Ma calls AI colonialism, the extraction of difficult, low-paid labor from the Global South for profit in the West. The Data Work Landscape project, which Ma used as a source, describes the same workforce more broadly: workers around the world who develop, train, test, and maintain AI systems, hidden behind virtual marketplaces and labyrinthine supply chains.
| Stage of data work | What the worker does | What the map shows about it |
|---|---|---|
| Develop and collect | Gather and prepare raw material for training | Firms and customers linked, not individual workers |
| Label and annotate | Tag text, images, and other material so a model can learn from it | Delivery centers as a proxy for worker location |
| Test and check | Review model outputs, including safety judgments on disturbing content | The safety-labeling burden Ma describes |
| Maintain | Keep the pipeline running as models and rules change | Ongoing relationships, not one-off jobs |
Why invisibility is the point
Ma argues the chain is kept opaque to avoid accountability, and that opacity has a practical consequence for workers themselves. The work is distributed, she says, and people do not even know about their fellow co-workers, which makes unionizing or anything like that just about impossible. A future iteration of the map, she hopes, could let workers identify each other. That is why she built it as a public education tool first: when people want to learn about AI and its social impact, the map puts it in the context of a larger economic and political structure, rather than a story about a clever machine. Her next target, she says, is mapping the labor implicated in the semiconductor industry, the material layer beneath the data layer.
What the map does not show
Three limits keep this pillar honest. First, the map is illustrative, not comprehensive, in Ma's own words; thirteen firms are the firms she could trace, not all the firms that exist. Second, a delivery center is a proxy for worker location, not a worker census: it shows where a firm operates, not how many people it employs there, what they are paid, or under what conditions they work, and the Brown report reviewed for this article publishes no wage figures for the map. Third, the map traces the labeling chain, not the whole AI supply chain: chip fabrication, energy, and hardware labor sit outside it, which is why Ma's semiconductor plan matters. A reader who treats the map as a complete atlas will overclaim. A reader who treats it as a first drawing of a hidden structure will use it correctly, as a tool for asking who profits, who pays, and who decides.
What the work becomes
Labeled data becomes the model, and the model is usually described as if it taught itself. Our explainer on how transformers actually work shows the machinery that turns labeled examples into predictions, but machinery is not the whole story. The examples themselves are chosen, cleaned, judged, and corrected by people, and the safety behavior users praise in a finished model is often the residue of workers reading the worst material on the internet so the model does not repeat it. The robot-training pipeline we covered in October, where companies pay for sensor recordings and repairs in exchange for footage, is the physical twin of this story: different sensors, same structure, a hidden workforce feeding a system that presents itself as autonomous. The question Ma's map asks is whether the people AI needs are visible enough to be paid, protected, and heard.
What would make it fairer
Ma's own hope is modest and specific: a more equitable distribution of AI labor and its spoils, starting with visibility. Our judgment, labeled as analysis rather than Ma's claim, is that visibility alone is not enough. Three disclosures would turn a map into accountability: which firms a company uses, in which countries, under what labor standards, published the way model cards publish benchmark scores. Until then, the map's real contribution is a habit of mind. Every time a model is described as learning, ask who taught it. Every time a company calls its AI autonomous, ask whose hands are missing from the picture. The map does not answer those questions for every firm. It makes them unavoidable for the thirteen it drew.
By ByteHerald Staff. Brown University, October 26, 2026, reported that student Cunyan Ma mapped 13 data-labeling companies, 141 corporate customers, and 31 countries with data worker sites, using existing databases and her own delivery-center database as a proxy for worker locations. Data Work Landscape, consulted October 26, 2026, describes AI data workers as people around the world who develop, train, test, and maintain AI systems, hidden behind virtual marketplaces and labyrinthine supply chains.
Comments
Post a Comment