Artificial Analysis launched Progress Index v1 on October 27, 2026, alongside Intelligence Index v5, placing language models released since November 2022 on one capability scale using item response theory, anchored so o3-mini at high effort scores 220 and GPT-5.5 at extra-high effort scores 320. The launch matters because it fixes the most common mistake in reading AI leaderboards: comparing scores across versions that were never measured on the same test.
Two indexes, two jobs
Artificial Analysis runs two measures, and the company is explicit that they answer different questions. The Intelligence Index is the primary measure of current model intelligence: a composite across tasks reflecting real-world usage today, updated periodically as evaluations are added and retired. The Progress Index is the measure of capability over time: a single scale designed for comparing models released years apart, even though the evaluations themselves changed. Use the first to pick a model for a workload today. Use the second to ask how much capability has actually grown since 2022. Swapping them is how a reader ends up claiming a model improved by 10 points when the test changed, not the model.
The reason scores across Intelligence Index versions cannot be compared is in the version history itself. Version 5, launched October 27, 2026, is the biggest upgrade since version 4 launched in January 2026. It adds two benchmarks, upgrades three, removes three, and moves 60 percent of the score onto private test sets or held-out answers for the first time, up from about 45 percent private data in version 4.3. A model that scores 58 on version 5 and a model that scored 58 on version 4.3 did not take the same test, and Artificial Analysis says so directly: each version is measured on a different set of evaluations, and scores across versions are not intended for long-run comparison. The Progress Index exists to give that long-run comparison a method, instead of leaving it to subtraction across incompatible versions.
What version 5 actually measures
Version 5 rests on nine evaluations, grouped into four areas at 25 percent each. Knowledge work carries AA-Briefcase at 15 percent, AutomationBench-AA at 5 percent, and GDP.pdf at 5 percent. Coding carries FrontierCode 2.0 at 15 percent and Terminal-Bench 4.0 at 10 percent. Science carries Terminal-Bench-Science at 15 percent and a private 40-question hard subset of CritPt v2 at 10 percent. General capability carries AA-Omniscience v1.1 at 15 percent, split into 10 percent accuracy and 5 percent non-hallucination, and HLE-Diamond at 10 percent. The new pieces are the point: FrontierCode 2.0 is 132 tasks in real open-source repositories, graded on whether a maintainer would merge the change, with any failed blocking check scoring zero; Terminal-Bench-Science is 70 agentic scientific research tasks in a terminal, where a task passes only if every test passes; HLE-Diamond is a refined 1,000-question version of Humanity's Last Exam, split evenly between reasoning and knowledge questions.
| Area, 25 percent each | Evaluations and weights |
|---|---|
| Knowledge work | AA-Briefcase 15 percent, AutomationBench-AA 5 percent, GDP.pdf 5 percent |
| Coding | FrontierCode 2.0 15 percent, Terminal-Bench 4.0 10 percent |
| Science | Terminal-Bench-Science 15 percent, CritPt v2 hard subset 10 percent |
| General | AA-Omniscience v1.1 15 percent (accuracy 10, non-hallucination 5), HLE-Diamond 10 percent |
The version 5 snapshot, at maximum effort unless noted, puts Claude Opus 5.5 first at 58, ahead of GPT-6 Astra at 57 and GPT-6.1 Sol at 55, with Gemini 4 Argon next at 50 on high effort. One day later, Gemini 4 Carbon was added at 59 on high effort, which is a post-launch addition, not a version 5 launch result, and this article keeps that distinction because launch-day leaderboards get quoted as if they were final. No single model leads all nine evaluations: Opus leads FrontierCode 2.0 at 46 percent, HLE-Diamond at 68 percent, and AA-Omniscience v1.1 at 48; Astra leads Terminal-Bench-Science at 63 percent and the CritPt hard subset at 72 percent; Claude Sonnet 5.5 leads AA-Briefcase at 1812 Elo; Kimi K3.1 Pro leads Terminal-Bench 4.0 at 67 percent; Gemini 4 Argon leads AutomationBench-AA at 78 percent; Muse Wonder Full leads GDP.pdf at 33 percent all-pass. A composite leader that wins three of nine evaluations is a useful summary, not a verdict on any single workload.
How the Progress Index links years together
The Progress Index uses item response theory, a statistical framework from psychometrics that places model capability and task difficulty on one shared scale. Each model gets one capability value. Each item, one task within a benchmark or a whole benchmark where only aggregate scores exist, gets a difficulty value, defined as the capability at which a model is expected to score 50 percent after the guessing floor is removed, and a discrimination value, describing how sharply the expected score rises as capability passes the difficulty. Models do not need results on the same benchmarks, because the fit estimates task difficulty from every model that attempted a task and model capability from the tasks each model attempted, with benchmarks that share models linking everything onto one scale. A model tested on older benchmarks and a model tested on newer benchmarks can therefore be compared directly, provided they connect through shared tasks and models.
Four method details decide whether that comparison is trustworthy. First, each benchmark carries equal weight for a model, regardless of how many tasks it has, and where a task was run more than once, repeats are averaged. Second, a benchmark must have results from at least four models, and a model must have results on at least four benchmarks, to enter the fit at all. Third, input scores are normalized to a zero-to-one range, with guessing rescaled to zero, so a 25 percent score on GPQA Diamond, with four options per question, counts as zero. Fourth, where a model's context window is too short for an evaluation, a zero is imputed: models with a context window under 100,000 tokens score zero on AA-LCR. Each effort variant is fitted as a separate model, and each model is represented by its highest-scoring variant. The scale is anchored so o3-mini at high effort scores 220 and GPT-5.5 at extra-high effort scores 320, chosen because both are stable frontier models with a clear performance gap across the evaluations. A fixed gap on this scale changes a model's odds of success on a given task by the same factor anywhere on the scale. The anchor numbers are scale points, not percentages, and they have no percentage unit.
The method is not invented for this launch. Artificial Analysis cites prior work using item response theory to evaluate machine learning models, the Epoch AI Capabilities Index approach, and Anthropic's capability-scale research, and says it built on learnings from the Epoch Capabilities Index in designing the Progress Index. That lineage matters for a reader judging the claim: the Progress Index is an application of an established estimation method to benchmark data, not a new formula announced without precedent. Its weakness is also standard for the method: the scale is only as connected as its shared tasks, and a model that attempted few shared items rests on thinner evidence than one tested broadly. The minimum-four-benchmarks rule is the guardrail against the thinnest cases, and it is worth checking whenever a surprising model appears on the scale.
The open-weights gap, read correctly
Version 5 widened the measured gap between proprietary and open-weights models, and the size of that widening is easy to misread. Under version 4.3, the gap between the leader and the best open-weights model was 3 points. Under version 5, it is 12 points: Kimi K3.1 Pro scores 46, against Opus at 58, but its weights had not been released in the launch snapshot. Among models with released weights, DeepSeek V4.1 Flash 1017 at maximum effort and GLM-5.3 at maximum effort lead at 32, which is 26 points behind the leader and below Claude Haiku 5.5 at maximum effort at 36. The gap is widest on HLE-Diamond and Terminal-Bench-Science, where Kimi scores 37 percent and 34 percent, against 68 percent for Opus and 63 percent for Astra.
| Open-weights reading, version 5 | Score | Status |
|---|---|---|
| Leader, Claude Opus 5.5 (maximum effort) | 58 | Proprietary reference |
| Kimi K3.1 Pro | 46, gap 12 points | Weights not yet released at launch |
| DeepSeek V4.1 Flash 1017 (maximum effort) | 32, gap 26 points | Released weights, joint leader |
| GLM-5.3 (maximum effort) | 32, gap 26 points | Released weights, joint leader |
| Version 4.3 gap, leader to best open model | 3 points | Prior version, different test set |
That widening does not establish that open models got worse. The test changed, the weights changed, and the share of private evaluations rose, all of which move a composite gap without any individual model deteriorating. What it does establish is that on the tasks version 5 weights most heavily, agentic coding and scientific research work with private grading, the best open models trail further than they did on the older, more public test mix. For a team choosing between a hosted frontier model and a downloadable one, the relevant comparison is narrower than the gap: Mistral Large 4's open-weights release shows how a single open model can be competitive on a specific coding configuration while trailing on the composite, and that workload-level reading beats the headline gap every time.
Effort and cost: the two numbers that change the ranking
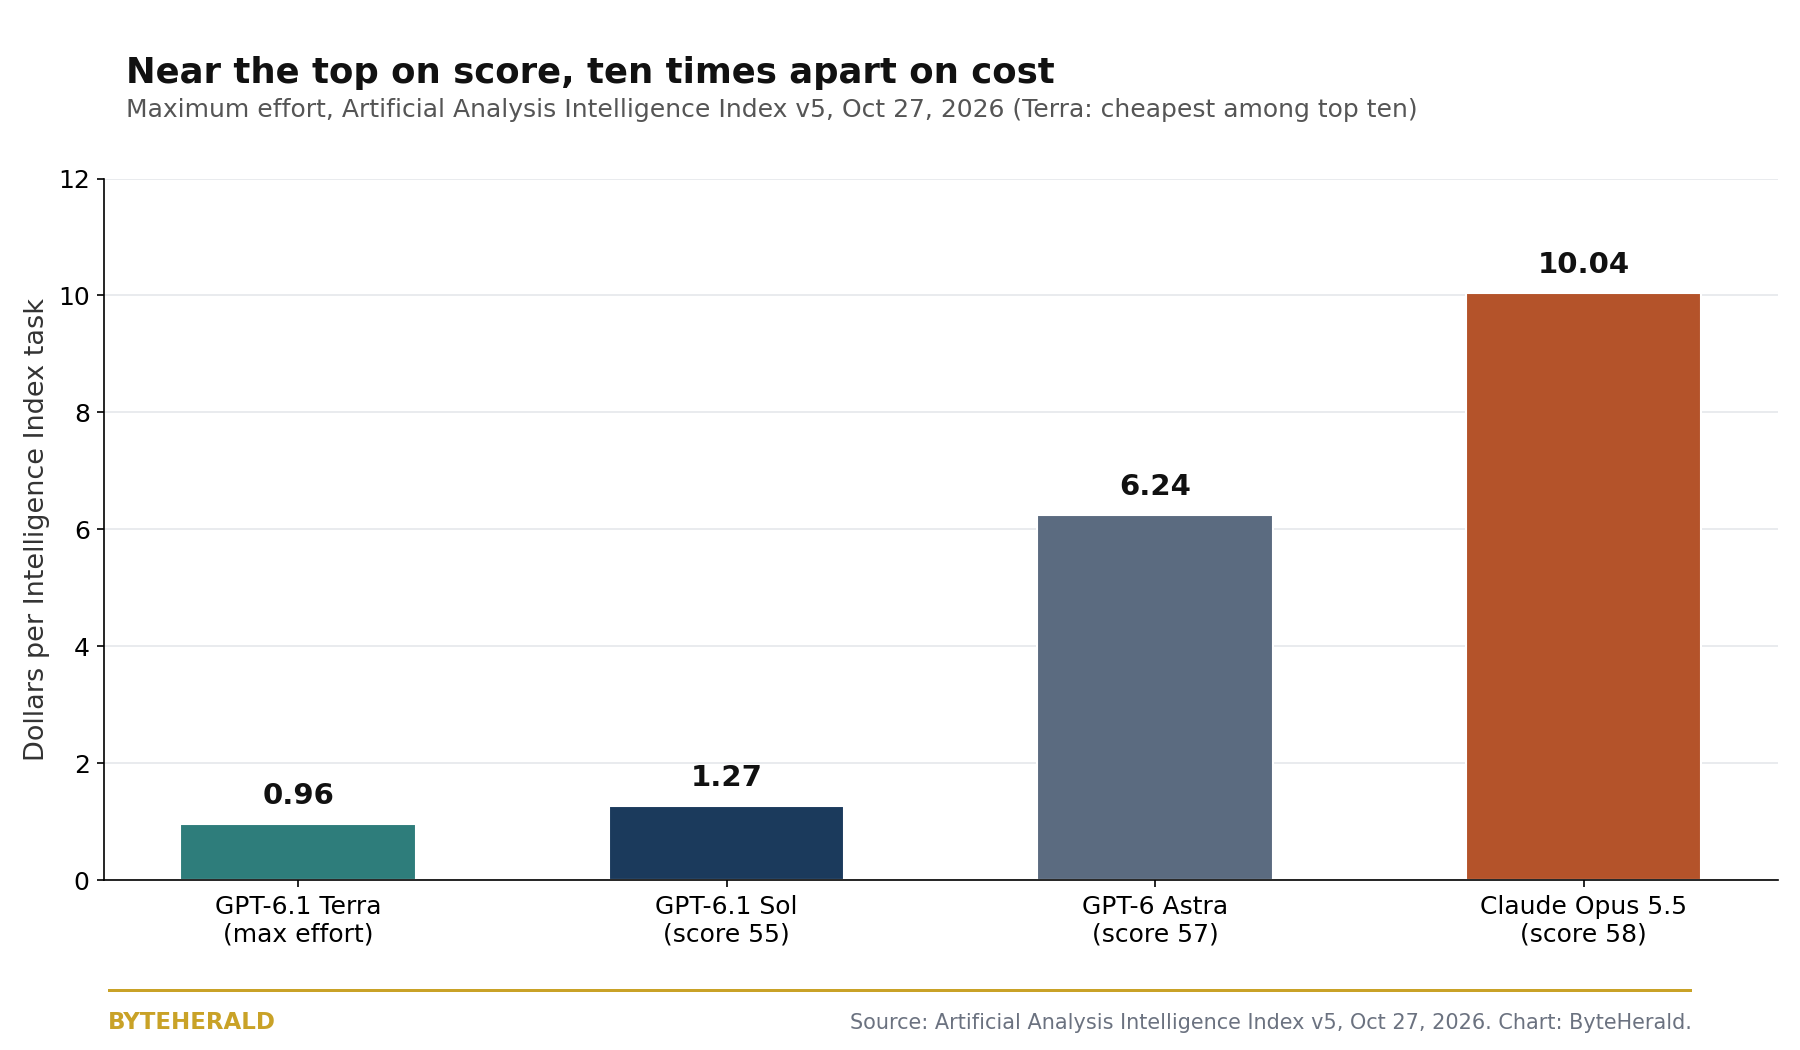
Version 5 makes effort settings matter more than version 4.3 did, and cost per task varies so widely that the ranking alone misleads a buyer. Claude Opus 5.5 scores 35 at low effort and 58 at maximum effort, at ten times the cost per Intelligence Index task: 0.98 dollars against 10.04 dollars. Claude Sonnet 5.5 spans 29 points from low to maximum effort, up from 20 points in version 4.3, and GPT-6.1 Sol's spread doubles from 10 to 20 points. Among the ten highest-scoring models, GPT-6.1 Terra at maximum effort is cheapest at 0.96 dollars per Intelligence Index task and Claude Fable 5.1 at maximum effort is most expensive at 13.04 dollars, a spread of more than 13 times. Opus at maximum effort costs 10.04 dollars per task, Astra 6.24 dollars, and Sol 1.27 dollars, which means Sol scores within four points of Opus at about an eighth of the cost per task.
Version 5 tasks also demand substantially more work from models. Every model measured generates more output tokens per Intelligence Index task than in version 4.3, with the median rising by two thirds, from 35,000 to 59,000 tokens. Agentic evaluations account for most of that token use: Terminal-Bench-Science, Terminal-Bench 4.0, AA-Briefcase, and FrontierCode 2.0 make up 55 percent of the index weight but a median of about 90 percent of output tokens, with Terminal-Bench-Science alone accounting for about a third of output tokens per task. For a buyer, the implication is direct, and it is the same lesson as our flash-model price scoreboard: a score without an effort setting and a cost per task is not a price, and a model that wins at maximum effort may lose at the effort setting a team can actually afford to run.
How to use the two indexes without fooling yourself
Four rules cover most misreadings. First, never subtract scores across Intelligence Index versions: a version 5 score and a version 4.3 score are different tests, and the Progress Index is the tool built for that comparison. Second, never quote a composite without its effort setting: Opus at low effort (35) and at maximum effort (58) are effectively different products at different prices. Third, treat one-point gaps as undecided: the version 5 launch figures carry no published uncertainty estimates for the narrowest gaps, so a one-point lead does not settle which model is better for a particular workload, and the leader-by-evaluation table shows why the composite alone cannot. Fourth, check the task mix before generalizing: a model that leads on science terminal tasks may trail on knowledge work, and the version 5 weights, 25 percent each for knowledge work, coding, science, and general capability, are a judgment about what real-world usage looks like today, not a law of nature.
One limit of this article belongs in the open. The full Progress Index time series, the curve of capability over time since November 2022, lives on Artificial Analysis's trends page as interactive charts, and this article does not reproduce per-model Progress Index values that the page's text does not return. Inventing those values from the version 5 announcement would repeat exactly the cross-version error the Progress Index was built to prevent. What this article does give a reader is everything needed to read that curve honestly when it is opened: the method that links the years, the anchors that set the scale, the version 5 snapshot that anchors the present end of the curve, and the effort and cost numbers that decide whether a point on the curve is affordable in practice. A scale is only useful if its readers know what it is not. The Progress Index is not a percentage, not a current-workload ranking, and not a substitute for testing a model on the task it will actually do.
By ByteHerald Staff. Artificial Analysis announcement titled "Announcing Artificial Analysis Intelligence Index v5," published October 27, 2026, gave the 60 percent private or held-out share, the two new benchmarks FrontierCode 2.0 and Terminal-Bench-Science, the three upgrades HLE-Diamond, AA-Omniscience v1.1, and CritPt v2, the nine-evaluation composition with four areas at 25 percent each, the leaders Claude Opus 5.5 at 58, GPT-6 Astra at 57, and GPT-6.1 Sol at 55, the open-weights gap widening from 3 points to 12 points with Kimi K3.1 Pro at 46 and released-weights leaders at 32, the cost spread from 0.96 dollars to 13.04 dollars per task among the top ten models, the effort spreads for Opus, Sonnet 5.5, and Sol, and the median output-token rise from 35,000 to 59,000 per task, and launched the Progress Index v1 for models released since November 2022. Artificial Analysis Progress Index v1 methodology, published October 2026, gave the item response theory joint estimation method, the capability, difficulty, and discrimination definitions, the guessing-floor rescaling with GPQA Diamond at 25 percent counting as zero, the equal benchmark weight per model, the minimum four models per benchmark and four benchmarks per model, the imputed zero for context windows under 100,000 tokens on AA-LCR, the highest-variant representation, and the anchors o3-mini at high effort at 220 and GPT-5.5 at extra-high effort at 320, with prior work from Epoch AI and Anthropic. WinBuzzer coverage, published October 28, 2026, gave Gemini 4 Carbon at 59 on high effort as a post-launch addition and noted that narrow gaps carry no published uncertainty estimates.
Comments
Post a Comment